主题
python
import streamlit as st
from wordcloud import WordCloud
import matplotlib.pyplot as plt
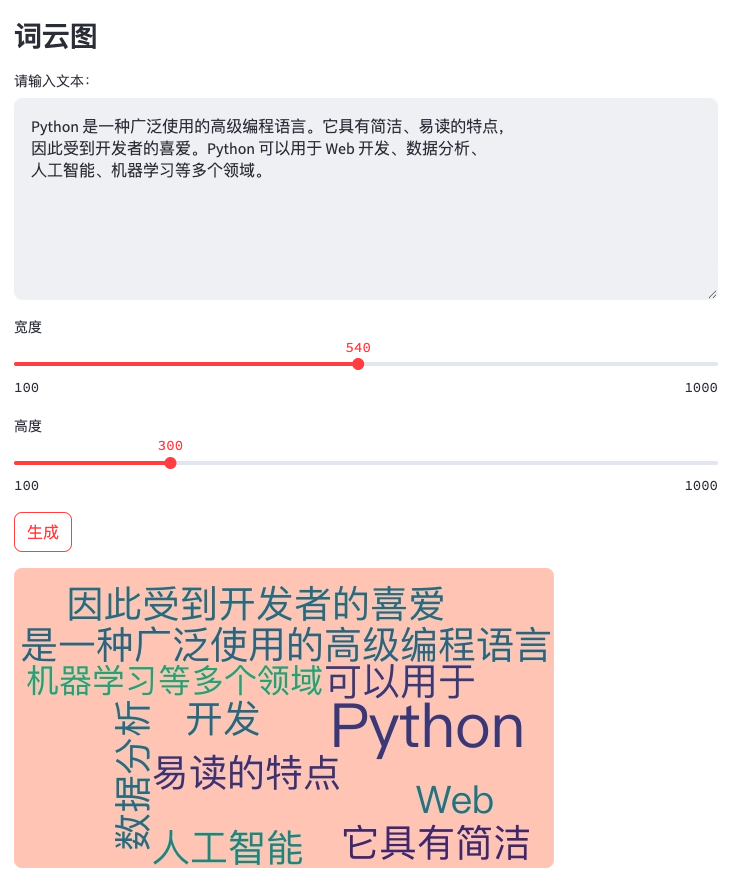
st.subheader("词云图")
text = st.text_area("请输入文本:",height=200)
width = st.slider("宽度", 100, 1000, 540)
height = st.slider("高度", 100, 1000, 300)
if st.button("生成"):
# 创建词云对象
wordcloud = WordCloud(
font_path="/System/Library/Fonts/PingFang.ttc", # 设置字体路径(支持中文),需要下载 simhei.ttf 或其他中文字体文件
width=width, # 设置宽度
height=height, # 设置高度
background_color="#ffccbb" # 设置背景颜色
).generate(text) # 根据文本生成词云
st.image(wordcloud.to_array())使用matplotlib
python
from wordcloud import WordCloud
import matplotlib.pyplot as plt

# 示例文本
text = """
LangChain,RAG,Prompt,链,向量数据库,Agent
"""

# 创建词云对象
wordcloud = WordCloud(
    font_path="/System/Library/Fonts/PingFang.ttc",  # 设置字体路径(支持中文),需要下载 simhei.ttf 或其他中文字体文件
    width=540,               # 设置宽度
    height=300,              # 设置高度
    background_color="#ffccbb" # 设置背景颜色
).generate(text)             # 根据文本生成词云

# 显示词云
plt.figure(figsize=(10, 5))  # 设置画布大小
plt.imshow(wordcloud, interpolation="bilinear")  # 显示词云
plt.axis("off")              # 关闭坐标轴
plt.show()